Facebook
Twitter
LinkedIn


What a path of discovery Quest undertook in 2021, as we started investigating how certain types of data were affected during the course of a typical online survey. From the Quirk’s Virtual Global Event (February 23) to a final wrap up last week with ESOMAR, but this won’t be the last you hear on the topic from us. As Quest’s co-founder and Managing Partner Greg Matheson mentions in his opening statement, the ESOMAR Webinar is indeed our final installment in our reporting series for 2021. But data quality and how it changes for “longer” surveys is a “forever question” in our minds, with so much more to look into in 2022.
After four identically implemented waves of our original survey, Quest has solid conclusions we stand behind – and many other hypotheses and questions going forward. The Webinar on December 2nd focused on a fourth wave of our original survey, as well as a newly experimental fifth wave, for the details elaborated here.
Our primary mission at the outset was a simple one: as the length of an online survey increases, what happens to respondent engagement and data quality? We found no definitive work the market research industry had completed to address this question – rather surprising given the fundamental and universal nature of the question for so many survey researchers and firms, as well as insights professionals at brand companies. We had found a quest for Quest!
To be clear, Quest is not attacking “long” surveys. Quite the contrary! Long surveys have a necessary place for so many research applications which require an extended respondent engagement. They are not going away, and we don’t advocate they should.
What we want to do is better understand what happens for respondents and the answers they provide during surveys to arm researchers with more knowledge about relevant issues for data quality and reliability. For example, that could mean developing a metric as direct as “data collected at the eight-to-ten minute interval in a typical consumer survey is 4% less accurate than data collected at the six to eight minute interval for rating and ranking questions”. Or it could end up being something entirely more complicated and different.
Quest pursued our investigation using a consumer Primary Grocery Shopper survey, following these steps consistently across the waves:
For a full statement of Waves 2/3, please visit here.
Our most recent wave:
For wave 4, we had a lot of data from earlier waves to compare. For the purpose of the webinar presented recently, we focused on one key indicator of respondent engagement, attention being paid to the survey as measured by the time spent answering our “measurement battery” questions at different points of the survey, considering this an imputed analog for data quality.. Our definition of “data degradation” based on this approach is the difference in time measured for respondents answering these specific questions earlier vs. later in our grocery shopping survey. As you’ll see, the “falloff” in time spent earlier vs. later is significant overall, and more so for certain types of questions vs. others. While this is just one view of the results of our several waves of the survey, it’s the most direct and demonstrable comparison, we believe, based on our goals for this research on research.
Our Results:
As described, our “measurement battery” was presented at about one minute into the survey, asked about one type of food category “purchased regularly”, then shown again at about seven minutes for a different category. First, we saw specific and consistent drop-off in time spent for the four “battery questions” across all our surveys:
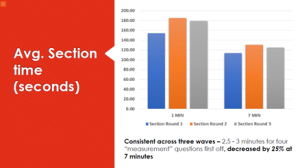
The graph above shows comparing each wave for the time spent for the battery of four questions – the left side for the earlier measurement at one minute into the survey and the right side same colored bar for the same battery at 7 minutes in. As the comment in the slide mentions, the result for the waves was consistent – about 25% falloff in attention across the four questions. Not conclusive, but compelling – we expected greater variability across the waves for the decrease in answer time, but saw very consistent drop-off for the four questions together.
We saw similar consistent drop-off results for each of the specific question types. But the ”data degradation factor”, our term for the drop-off in answer time between measurements, was quite different for the different question types.
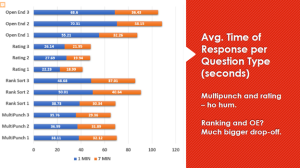
What did Quest see for the parts making up that 25% drop-off whole? A couple of the question types didn’t show dramatic change (i.e., comparing the length of the blue bar to that of the orange bar). The rating and multi-select questions weren’t significant for the lesser time spent between the first and second measurements. They declined, but not enough to warrant particular concern. The ranking question and open-ends showed much more significant changes – the time spent answering at one minute and seven minutes was a much greater decline for these question types. The open ends, in particular, were the big story – again, consistently across the waves of research.
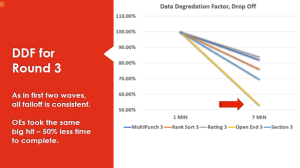
Our preferred way to represent DDF, our “data degradation factor”, is to set the time spent initially for each of the question types as 100%, at the first measurement point a minute into the survey. Then to compare the percentage drop in time spent by the second measurement at 7 minutes.
The important result is the open ends – from the bar charts shown earlier, you’ll see respondents spent on average of one minute answering the first open end. By seven minutes into the survey, that declined by half. From one minute to thirty seconds, for a similar question but a different subject, so a “familiarity factor” doesn’t account for that, in my opinion.
The consistent results across four waves show us we’re losing respondent’s attention after a few minutes into a typical quantitative grocery shopping survey for questions that require more thinking than others. Easy questions such as rating or multi-select? Not too bad, still lesser attention but not worrying, right? But when you ask respondents to do more, after just a few minutes, you start to lose their attention. Wow, we said.
That result was what we saw after the first survey, so we did that survey again, and again, and again for our four waves to date. With the same result, the same degree of attention loss and “DDF”, each time. More wow, we said.
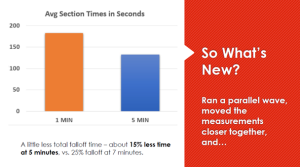
What did Quest do for our “new fifth wave?” Based on a suggestion from an audience member in Chicago, we decided to see if the DDF dropoff was happening even sooner than seven minutes into the survey – “move the second measurement as close as you can to the first” they said, “and see what happens for DDF then”.
We conducted a parallel wave alongside our fourth wave replication of the initial research – separate, but using the same survey other than removing some questions between the measurement batteries. Doing so, they were presented at one and five minutes into the survey. Overall, we saw about 15% dropoff for the four question battery total time spent (vs. 25% for the one and seven minute comparisons for the main research).
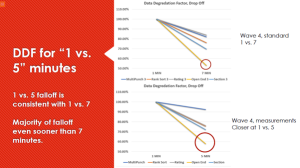
Showing the two latest waves (i.e, four and five) next to each other, the open end dropoff is surprisingly similar, almost linear. Most of the open end DDF happened by five minutes into the survey, and if you extend the line showing DDF to seven minutes, it matches really closely to our separate wave measuring at one and seven minutes. I call this a confirming fifth wave, really – we’re seeing just the results expected if the DDF dropoff happens early, and then is measured further in the survey.
Our bottom line, for now: Everything we’ve done has shown consistent (and frankly, somewhat troubling) answers to our original question. Respondents’ attention is waning early in a survey that shouldn’t be taxing. The “more difficult” questions are showing more decline in time spent answering. This has serious implications for survey design and expectations for respondents participating in “longer” surveys. Your surveys, your data, your clients are being affected now in ways that we’ve just begun to uncover.
NEXT STEPS:
We’re not done with this investigation. We’ve received numerous suggestions about other avenues to channel our further research for this topic. For example: Would audio or video open end capture mitigate the data degradation seen with written answers? Are questions like Rank Sort, a more “engageable” respondent exercise, immune from data degradation? What about other audiences (beyond those primary grocery shoppers), other topics, different incentives, other countries besides the U.S.? What about B2B? So many possible avenues to extend our original focus and work to see what more we can discover and contribute.
Look for more from Quest as we dig deeper, gain better knowledge and insights, and share them with researchers everywhere.
Click here for more market and survey insights from Quest Mindshare.
~ ‘Data Degradation’ was first presented at the Quirk’s Virtual Conference on Feb 23rd, 2021. Round 2 was first presented at the IIEX Behavior Event by Greenbook. A downloadable copy of the presentation video (round 2) can be accessed by emailing Moneeza at mali@questmindshare.com. For further information, slides or any questions, please do contact any of the following:
Greg Matheson (Managing Partner) gmatheson@questmindshare.com
Scott Worthge (Senior Director, Research Solutions) sworthge@questmindshare.com
Moneeza Ali (Director, Marketing) mali@questmindshare.com

Now we couldn’t exactly compare it to a chinook or anything, but a curious warmth settled over Quest’s HQ this week as the Quest family held it’s 2024 Annual General Meeting – and it was the perfect company event backdrop for the over friendly, warm faces that made their way to the charming town of […]
Read Article
In March 2024, Quest travelled to Quirks Chicago, presenting further information about household income with Lara Fordis Every U.S. consumer survey conducted asks the same question: “Which of the following represents your annual household income?” But both parts of that phrase – “households” and “income” – have undergone massive changes in the U.S. in the […]
Read Article
In September 2024, Quest travelled to Greece, presenting further information about synthetic data at ESOMAR Congress Synthetic data and its potential to replace actual respondent data is a contentious topic in online research. Can data developed by programs instead of people be trusted? How accurate is it when compared to ‘real’ data? While many in […]
Read Article